Gantt Chart Software
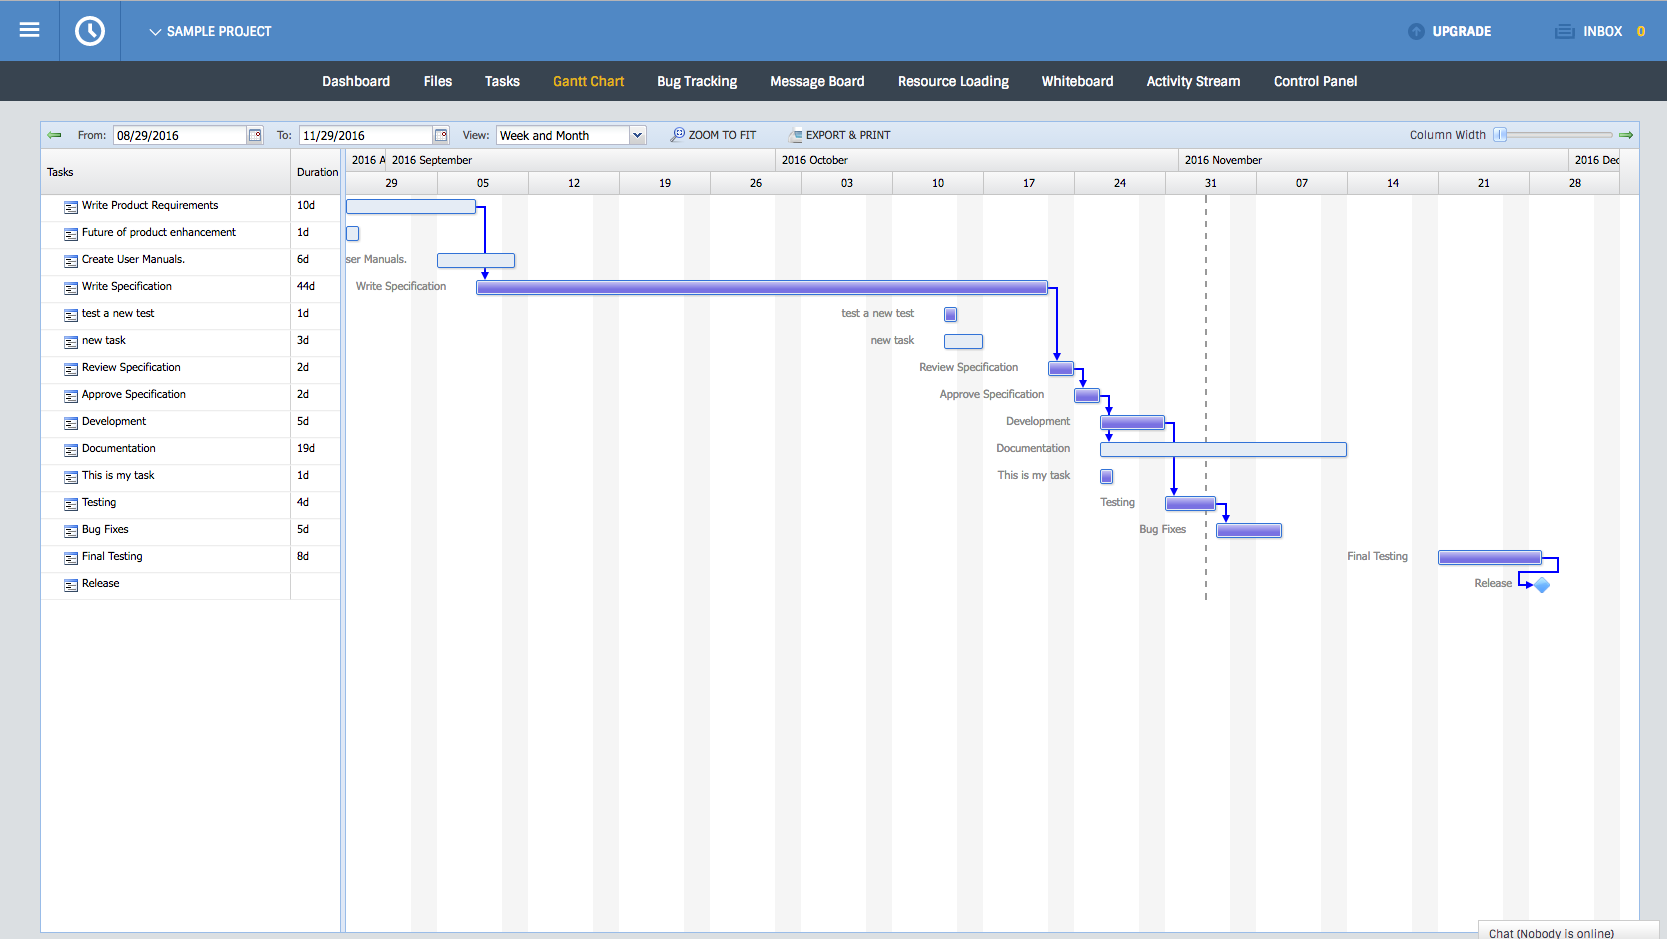
To view and make sense of all tasks and their relations in complex projects is not an easy thing to do. To help the project manager and the team to have a high level view of their project, Binfire provides the Interactive Gantt chart. For a detailed description of a Gantt chart, refer to Wikipedia’s description here. The Gantt chart is the best way to view what is happing in your project graphically and in real time. Notice that this page is live and if you make changes on this page, your team members see the change in real time (this is true for all pages in Binfire). You can move or change tasks in the Gantt, but can't create new tasks in this page yet. To move a task bring the mouse to the middle of a task, grab it by clicking and move it. To make a task longer or shorter, bring the cursor to either edge of a task, grab, extend or shorten. The application automatically adjusts the time scale to fit your project’s duration. If you need to change the time scale yourself, use the drop down box on top of the page to change from day, to week, to month or year time scale.
In addition you can change the start and end dates for the Gantt view.
You can also sort tasks and duration columns. Bring the cursor to the top of each column (task or duration). A drop-down arrow shows up when the cursor is hovering there. This dropdown lets you sort tasks in ascending or descending order.
Another feature is the export feature found on the top of the Gantt chart. The Gantt chart is exported as a PNG file format that you can use in presentations or print if you would like.
 Prev: Next: Project Resource Loading