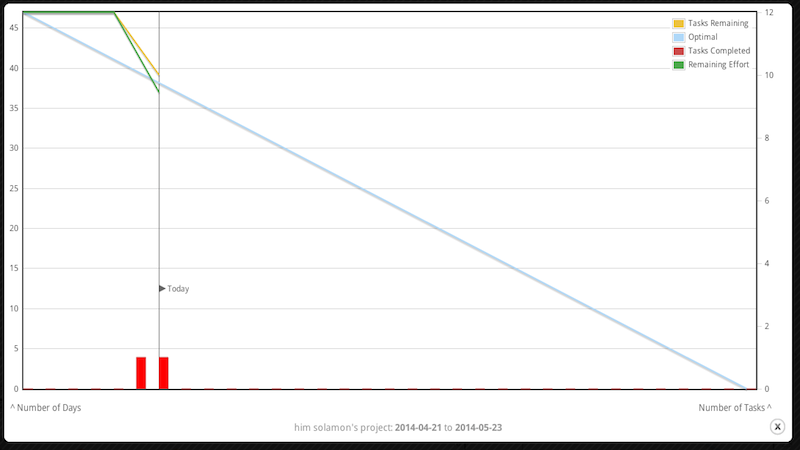
Burndown Chart
The single best way to view your project progresses during the project life cycle is the burndown chart. As tasks are completed, the burndown chart is automatically updated to reflect the status of the project. Here, you can see if your project is on schedule or not. If it is late, by how many man days the project is behind. You can see how many tasks are completed and how many are late and how many more tasks are still open. All this information is presented graphically in a single easy to understand view, which is updated in real time. This chart is the ideal graph to take to project meetings or project reviews.